Predicting Airline Delays: Part 1
Flight delays are among the biggest nightmares for travellers. According to the Bureau of Transportation Statistics, there are about ~15,000 scheduled flights per day in the United States, with more than two million passengers flying every day! (Source). While majority of scheduled flights land at or before their scheduled time, about 19% of all flights are delayed.
A delay is defined as any flight which arrives at the gate at least 15 minutes later than the scheduled arrival time. Data shows that an average of 2950 flights are delayed more than 15 minutes every day! Traditionally, the biggest causes for airline delays have been weather and bottlenecks in the Federal Aviation Administration’s system, which includes factors like congested airports and other problems with the air-traffic system. However, according to a Bloomberg report, delays caused by Airline factors have exceeded delays caused by weather or the air-traffic system. These include late arrivals triggered by mechanical breakdowns, lack of flight crews and other factors attributed to the airlines companies.
In this project, I intend to use several years of flight data from the Bureau of Transportation Statistics to find out which airlines are the best and worst performers, and which airline performs the best given a particular route.
I used a corpus of data from 17 million flights from September 2013 to August 2016 from the website of the BTS. The data is made available in monthly files, with the option to select the fields for download. For this study, I focused on four things:
- Exploring historical arrival delays across different airlines, airports and time of the day, trying to get some insights on which airlines or airports are more prone to delays.
- Studying the effect of weather on airline delays. Given bad weather, does one airline perform better than the other?
- Build a predictive model to forecast a flight delay
- Create a web application to quantify the difference in performance between various airlines in terms of arrival and departure delays, given the origin and destination airports.
The code for the analysis can be found here.
Exploring Historical flight delays
A good measure for on-time performance of a flight is the difference in minutes between scheduled and actual arrival time. The dataset contains this information in the ARR_DELAY feature, and early arrivals show negative numbers. I started by visualizing the arrival delays for the top ten airlines, sorted by the number of scheduled flights in our dataset.
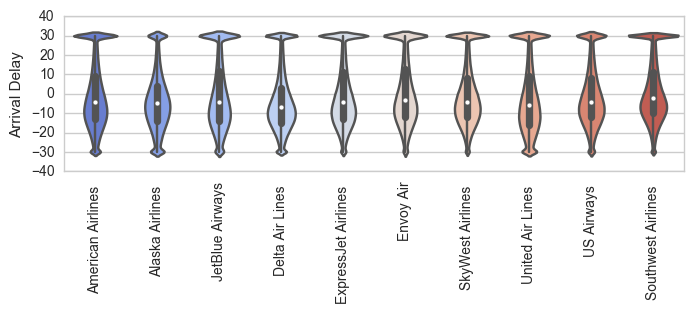
ARR_DELAY for the top 10 Airlines (by number of flights)
It is observed that the median Arrival Delay lies between -10 and 0 for all the airlines, i.e. most flights arrive before time. The width of the plots at 30 denotes the frequency of flights arriving 30 minutes or more after the scheduled arrival time. However, a better measure for quantifying the performance of airlines would not consider early arrivals as negative delays, since it brings down the mean arrival delays to near zero values.
Which Airline should you choose?
If we consider only late arrivals as Positive Arrival Delays (i.e. Early or on-time arrivals are considered as 0), the average delay lies between 5 and 15 minutes.
As see above, most flights tend to arrive on or before time. But still, a big chunk of flights do get delayed by more than 15 minutes. Which airlines have the worst records of delays greater than 15 minutes?
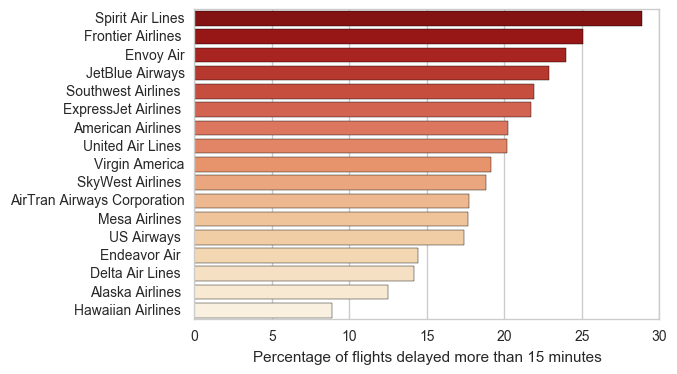
Spirit Airlines is the worst performer, with 28.8% of its flights delayed more than 15 minutes, followed by Frontier Airlines (25%) and Envoy Air (24%). Hawaiian Airlines and Alaska Airlines are the best performers, with only 8.8% and 12.5% of their flights delayed more than 15 minutes respectively.
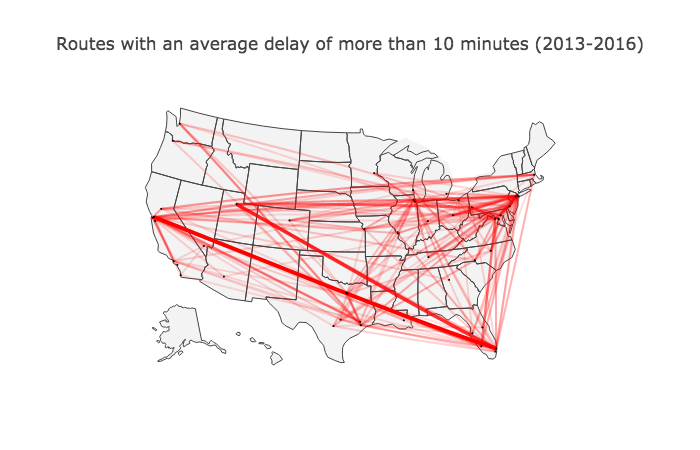
Flight paths delayed more than 15 minutes on average. Darker lines represent greater average delays
What time of the day are you most likely to be delayed?
Early morning flights tend to have lower flight delays, and the average delay increase with hour of the day. Flights departing late evening tend to have the highest average delays, probably caused by the gradual accretion of delays through the day. Thursday evenings have the highest average delays (~20 minutes)
Effect of Weather of Delays
To remove the effect of weather from the historical flight delays, we need local weather data at the origin and destination airports for each flight in the dataset. To keep things simple, I selected the 50 airports with the highest air traffic. Approximately 10 million flights (62% of the entire dataset) originated and terminated in the top 50 airports.
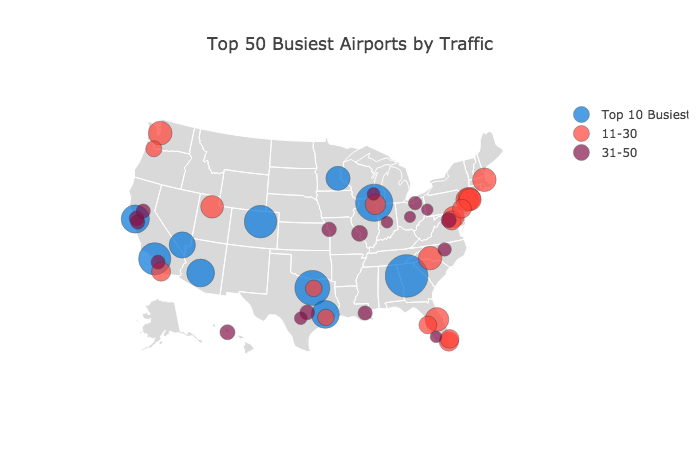
Top 50 Airports by traffic (Arrivals + Departures)
Next, I downloaded hourly observational weather data from NOAA’s National Centers for Environmental Information (NCEI) website. From the weather dataset, the local weather variables for the origin and the destination airports were appended to the main Airline Dataset for each and every flight. Also, the mean weather for every airport was computed, and the mean weather for origin and destination airports were added to the dataset for each flight.
Machine Learning model to predict airline delay
The objective of our model is to predict arrival delay. Arrival Delay (ARR_DELAY) is highyl skewed, majority of flights having zero or a small arrival delay. We break the problem into two subparts:
Delay Classification Model
- Classify [0/1] whether a flight is delayed more than 5 minutes or not
- Trained a Logistic Regression model
- Trained on 400000/600000 splits of positive and negative samples
- Averaged predictions over n=100 models
- Output probability of delay P(delay)
Predicted Delay
- Regression using Linear Regression
- Trained on only on positive delays (ARR_DELAY>=5)
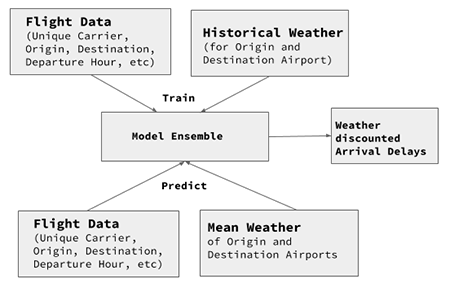
Finally, we use our model to predict ARR_DELAY with mean weather of the Origin and Destination airport for each flight in our dataset. For example, consider a flight from JFK to SFO, which arrived 25 minutes late while it was raining heavily at SFO. Using our model, we predict what the delay would have been, if precipitation at SFO was exactly equal to the annual mean precipitation.
Some airlines tend to perform better when we discount the effect of weather. For example, Expressjet has a higher average delay than JetBlue - however, when we discount the effect of weather from arrival delays, JetBlue has a higher average arrival delay. For Delta Airlines, average arrival delays are significantly reduced when the effect of weather is removed.
To summarize, weather is a big factor leading to flight delays. By offsetting the effect of weather, we can provide a level playing ground to compare two airlines head-on. There is much more to explore with this dataset, factoring in passenger load, airport load, routes, etc… just waiting to be analyzed. In the next part, I will compare performances of all airlines operating on an user-defined specific routes (Origin-Destination airport pair).
